Handling multiple geotiff as an ImageMosaic with Time and Elevation
ImageMosaic allows to create a mosaic of several datasets to be served through a single coverage store. The granules can be organized not only spatially but also on other dimensions, like the time and elevation.
The ImageMosaic plugin uses some auxiliary files in order to recognize and organize the granules along the dimensions.
Look at the
%TRAINING_ROOT%/geoserver_data/coverages/lamma/. The folder contains several files:GeoTiff granules inside the sub-folders. The names contain several parts separated by underscore (
_), likearw12kmTemperatureheightaboveground20130909T120000000Z_0002.000_0002.000_20130909T120000000Z_20130909T120000000Z_0_-9999.0
indexer.properties. A text file containing the structure of the schema of the database that will describe the mosaic structure. In particular, it’s possible in this case to recognize the names of the elevation and time attributes.
elevationregex.properties. A text file containing a regular expression to be applied to the file name. The regular expression will be used by the indexer in order to extract the elevation value from the granule name.
timeregex.properties. A text file containing a regular expression to be applied to the file name. The regular expression will be used by the indexer in order to extract the time value from the granule name.
datastore.properties. Optional text file containing the connection parameters to an external database. By default, if not specified, the indexer will create and use a shapefile in the same folder.
edit the timeregex.properties by appending the requested datetime format:
,format=yyyyMMdd'T'HHmmssSSS'Z'
edit the indexer.properties by removing the UseExistingSchema property
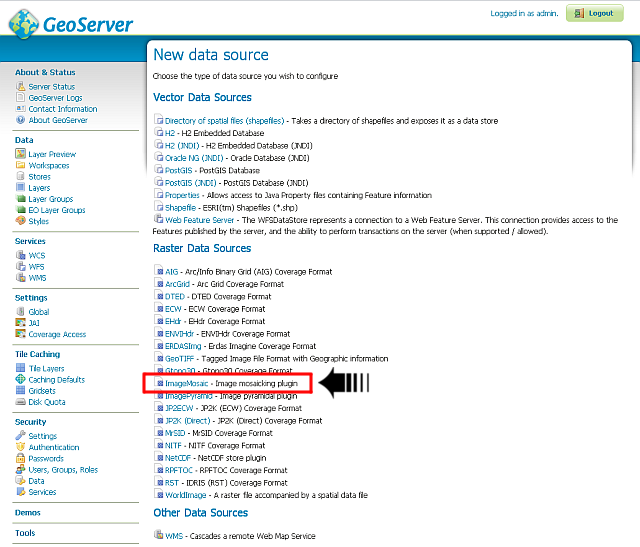
From the GeoServer Administration GUI, go to the Stores > Add new Store page and select ImageMosaic from the Raster Data Sources list
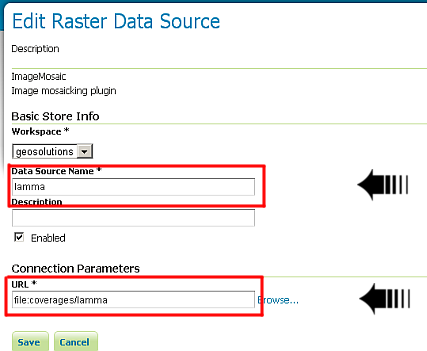
Insert lamma as Data Source Name and file:coverages/lamma as URL
Warning
If Postgis has not already been started the user must go to
%TRAINING_ROOT%and launchpostgis_start.Note
The granules have been taken from the Lamma Meteo forecasts (http://www.lamma.rete.toscana.it/) public portal provided by GeoSolutions http://geoportale.lamma.rete.toscana.it/MapStore/public/ .
Note
Notice that the ImageMosaic plugin requires the folder name. Notice also that since the dataset is physically located under the ${GEOSERVER_DATA_DIR} you can use a relative path.
Publish the new layer

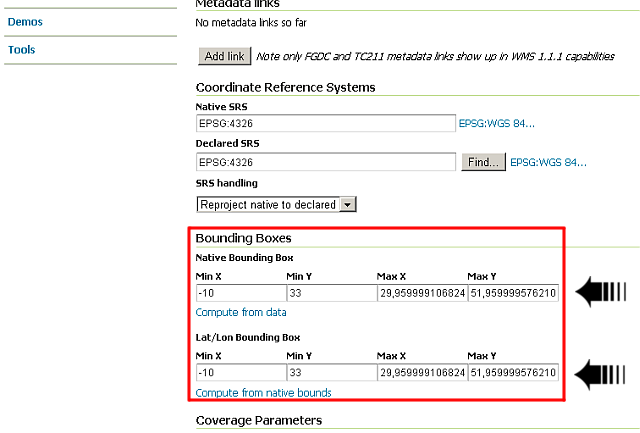
On the Data tab, make sure the Bounding Boxes values are correctly computed as depicted on the figure below
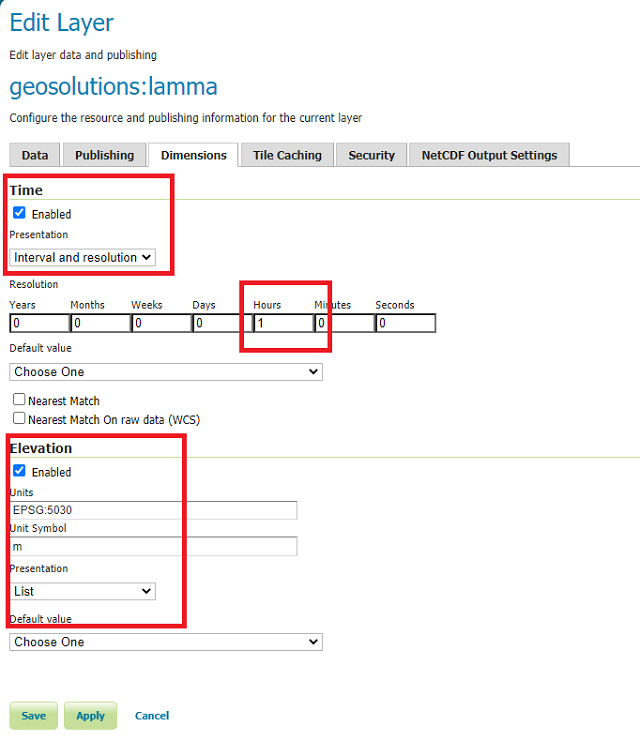
Switch now on the Dimensions tab and configure the time and elevation dimensions as depicted on the figure below
Note
Each dimension field combobox allows three choices List, Interval and resolution and Continuous interval. The correct value is up to you and depends on the data structure and the desired presentation.
List: will show the dimension values as a list of different values. Must be used when the dimension has a discrete set of uncorrelated values.
Interval and resolution: will show the dimension values as an interval (start/end) and a resolution. Can be used when the dimension has a regular spaced set of values.
Continuous interval: will show the dimension values as a range (start/end). Must be used when the dimension has a continuous set of uncorrelated values.
In our example the time values are regular with an interval of 1 hour, while the elevation ones are not regular.
Click on Save button
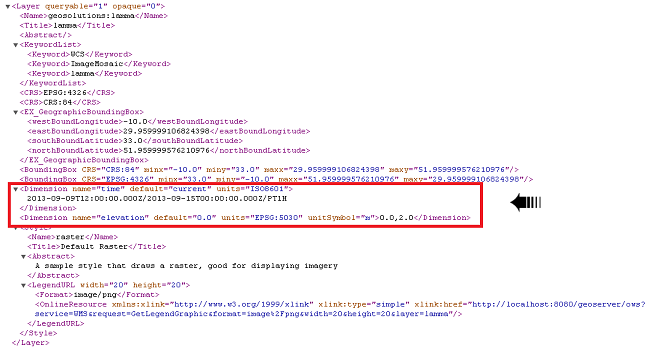
In order to see how the layer is presented by the WMS-EO, open a new tab on the browser and perform a WMS 1.3.0 GetCapabilities request:
http://localhost:8083/geoserver/ows?service=wms&version=1.3.0&request=GetCapabilities
Note
Notice the two Dimension nodes for the time and elevation presenting the values respectively as an interval with resolution (time) and a list (elevation) along with the unit of measures.
Have a look at the arw_temp style, already uploaded in your GeoServer on GeoServer. This style contains a color map that can be used to display temperature.
<?xml version="1.0" encoding="UTF-8"?> <StyledLayerDescriptor xmlns="http://www.opengis.net/sld" xmlns:ogc="http://www.opengis.net/ogc" xmlns:xlink="http://www.w3.org/1999/xlink" xmlns:xsi="http://www.w3.org/2001/XMLSchema-instance" version="1.0.0" xsi:schemaLocation="http://www.opengis.net/sld http://schemas.opengis.net/sld/1.0.0/StyledLayerDescriptor.xsd"> <NamedLayer> <Name>TemperatureCelsius</Name> <UserStyle> <Name>TemperatureCelsius</Name> <Title>TemperatureCelsius</Title> <Abstract>Style TemperatureCelsius</Abstract> <FeatureTypeStyle> <FeatureTypeName>Feature</FeatureTypeName> <Rule> <RasterSymbolizer> <Opacity>1.0</Opacity> <ColorMap type="intervals"> <ColorMapEntry color="#000080" quantity="-14.00" label="TEMP <= -14" opacity="1.0" /> <ColorMapEntry color="#0000C0" quantity="-12.00" label="-14 < TEMP <= -12" opacity="1.0" /> <ColorMapEntry color="#1464d2" quantity="-10.00" label="-12 < TEMP <= -10" opacity="1.0" /> <ColorMapEntry color="#2882F0" quantity="-8.00" label="-10 < TEMP <= -8" opacity="1.0" /> <ColorMapEntry color="#50A5F5" quantity="-6.00" label="-8 < TEMP <= -6" opacity="1.0" /> <ColorMapEntry color="#78B9FA" quantity="-4.00" label="-6 < TEMP <= -4" opacity="1.0" /> <ColorMapEntry color="#96D2FA" quantity="-2.00" label="-4 < TEMP <= -2" opacity="1.0" /> <ColorMapEntry color="#B4F0FA" quantity="0.00" label="-2 < TEMP <= 0" opacity="1.0" /> <ColorMapEntry color="#E6FFB4" quantity="2.00" label="0 < TEMP <= 2" opacity="1.0" /> <ColorMapEntry color="#BEFAB4" quantity="4.00" label="2 < TEMP <= 4" opacity="1.0" /> <ColorMapEntry color="#00CE7B" quantity="6.00" label="4 < TEMP <= 6" opacity="1.0" /> <ColorMapEntry color="#00AA00" quantity="8.00" label="6 < TEMP <= 8" opacity="1.0" /> <ColorMapEntry color="#7BCE00" quantity="10.00" label="8 < TEMP <= 10" opacity="1.0" /> <ColorMapEntry color="#CEE700" quantity="12.00" label="10 < TEMP <= 12" opacity="1.0" /> <ColorMapEntry color="#FAFA28" quantity="14.00" label="12 < TEMP <= 14" opacity="1.0" /> <ColorMapEntry color="#FFCE00" quantity="16.00" label="14 < TEMP <= 16" opacity="1.0" /> <ColorMapEntry color="#FF9C00" quantity="18.00" label="16 < TEMP <= 18" opacity="1.0" /> <ColorMapEntry color="#FF6300" quantity="20.00" label="18 < TEMP <= 20" opacity="1.0" /> <ColorMapEntry color="#FF0000" quantity="22.00" label="20 < TEMP <= 22" opacity="1.0" /> <ColorMapEntry color="#CE0000" quantity="24.00" label="22 < TEMP <= 24" opacity="1.0" /> <ColorMapEntry color="#9C0000" quantity="26.00" label="24 < TEMP <= 26" opacity="1.0" /> <ColorMapEntry color="#780000" quantity="28.00" label="26 < TEMP <= 28" opacity="1.0" /> <ColorMapEntry color="#9C00FF" quantity="30.00" label="28 < TEMP <= 30" opacity="1.0" /> <ColorMapEntry color="#FF00FF" quantity="32.00" label="30 < TEMP <= 32" opacity="1.0" /> <ColorMapEntry color="#FFAAFF" quantity="34.00" label="32 < TEMP <= 34" opacity="1.0" /> <ColorMapEntry color="#DCDCFF" quantity="36.00" label="34 < TEMP <= 36" opacity="1.0" /> <ColorMapEntry color="#A08CFF" quantity="38.00" label="36 < TEMP <= 38" opacity="1.0" /> <ColorMapEntry color="#483CC8" quantity="40.00" label="38 < TEMP <= 40" opacity="1.0" /> <ColorMapEntry color="#3C28B4" quantity="100.00" label="TEMP > 40" opacity="1.0" /> </ColorMap> </RasterSymbolizer> </Rule> </FeatureTypeStyle> </UserStyle> </NamedLayer> </StyledLayerDescriptor>
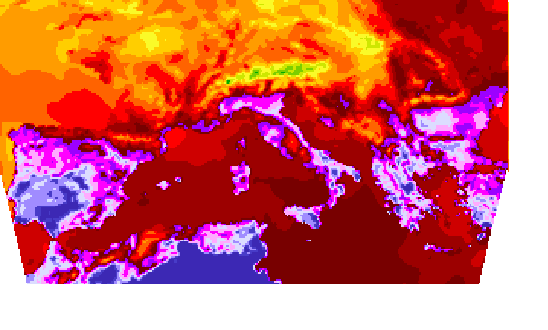
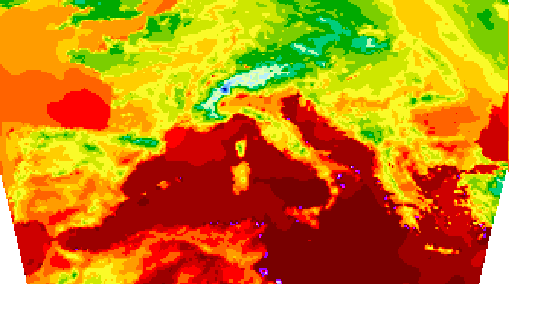
Perform several GetMap requests changing time and elevation values accordingly to the dimension values reported by the GetCapabilities
Elevation(0.0) / Time(2013-09-09T12:00:00.000Z):
Elevation(0.0) / Time(2013-09-10T00:00:00.000Z):
- Play with values:
- Elevation(0.0; 2.0)
- Time: try increments by hours or days
