Producing and Using palettes
GeoServer has the ability to output high quality 256 color images. This tutorial introduces you to the palette concepts, the various image generation options and offers a quality/resource comparison of them in different situations. In this section the task is to use the palettes.
Note
Some image formats, such as GIF or PNG, can use a palette, which is normally a table of 256 colors to get a better compression (trading it sometimes with a lower image quality). Basically, instead of representing each pixel with its full color triplet, which takes 24bits (plus eventual 8 more for transparency), they use a 8 bit index that represent the position inside the palette and thus the color. This allows for images that are 3-4 times smaller than the standard images with the limitation that only 256 different colors can appear on the image itself. Depending on the actual map, this may be a very stringent limitation visibly degrading the image quality, or it may be that the output cannot be represented from a full color image. For many common vector maps one can easily find 256 representative colors that are a good fit. In the latter case, the smaller footprint of paletted images is usually a gain in both performance and costs, because more data can be served with the same internet connection and the clients will obtain faster responses.
Options to enable paletted output
The easiest way to get a paletted image output is to ask for a 256 color output format, such as:
- image/png8: PNG output, with a 256 color palette
- image/gif: standard GIF output
These output formats, if no other parameters are provided, do compute the optimal palette on the fly. This is an expensive process (CPU bound) but, depending on the speed of the network connecting the server and the client, the extra CPU cost can be offset by a lower data transfer time (especially on slow/busy networks).
Optimal palette computation is anyway a repetitive work that can be done up front: a user can compute the optimal palette once and tell GeoServer to use it. There are three ways to do so:
- Use the internet safe palette, a standard palette built in into GeoServer, by appending palette=safe to the GetMap request. Of course, to get good results, the styling will have to be made using the colors in that palette.
- Provide a palette by example. In this case, the user will generate an 256 color images using an external program (such as Photoshop), and then will save it into the $geoserver_data/palettes directory. The sample file can be either in GIF or PNG format. If the file is named mypalette.gif or mypalette.png, the user will be able to refer it appending palette=mypalette to the GetMap request. GeoServer will load the palette from the file and use it.
- Provide a palette file. The process is just as before, but this time only the palette, in .PAL format, will be stored into the $geoserver_data/palettes directory. The PAL file in in Microsoft Palette Format, and can be generated by programs such as Paint Shop Pro and IrfanView.
An Example with Vector Data
Enough theory, let’s have a look at how to deal with paletted images in practice. We’ll use the prato basemap to gather some numbers and we’ll change various parameters in order to play with formats and palettes. Here goes the sampler:
The standard PNG full color output:
http://localhost:8083/geoserver/wms?service=WMS&version=1.1.0&request=GetMap&layers=geosolutions:BoulderCityLimits,geosolutions:blakes,geosolutions:bplandmarks,geosolutions:brivers,geosolutions:Mainrd&styles=&bbox=3056181.93510,1237476.92868,3080671.07513,1260141.38768&width=512&height=475&srs=EPSG:2876&format=image/png
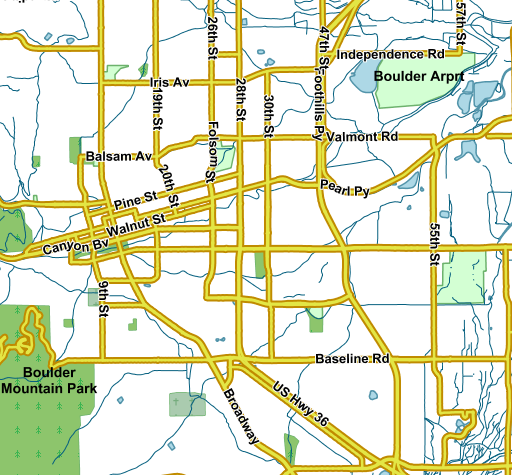
The standard PNG output
Parameters:FORMAT=image/png | Size: 131 KB | Map generation time: 186 ms
JPEG output:
http://localhost:8083/geoserver/wms?service=WMS&version=1.1.0&request=GetMap&layers=geosolutions:BoulderCityLimits,geosolutions:blakes,geosolutions:bplandmarks,geosolutions:brivers,geosolutions:Mainrd&styles=&bbox=3056181.93510,1237476.92868,3080671.07513,1260141.38768&width=512&height=475&srs=EPSG:2876&format=image/jpeg
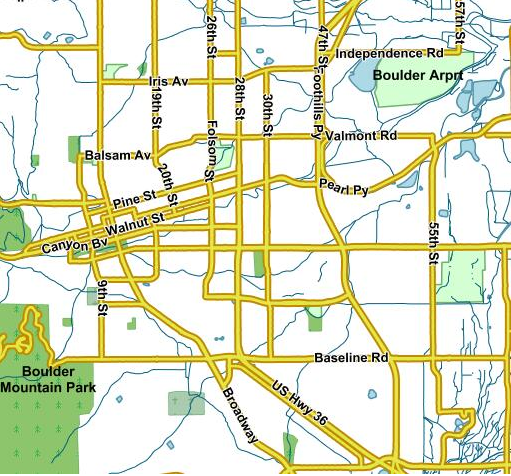
JPEG output
Parameters:FORMAT=image/jpeg | Size: 64 KB | Map generation time: 100 ms
The PNG8 output:
http://localhost:8083/geoserver/wms?service=WMS&version=1.1.0&request=GetMap&layers=geosolutions:BoulderCityLimits,geosolutions:blakes,geosolutions:bplandmarks,geosolutions:brivers,geosolutions:Mainrd&styles=&bbox=3056181.93510,1237476.92868,3080671.07513,1260141.38768&width=512&height=475&srs=EPSG:2876&format=image/png8
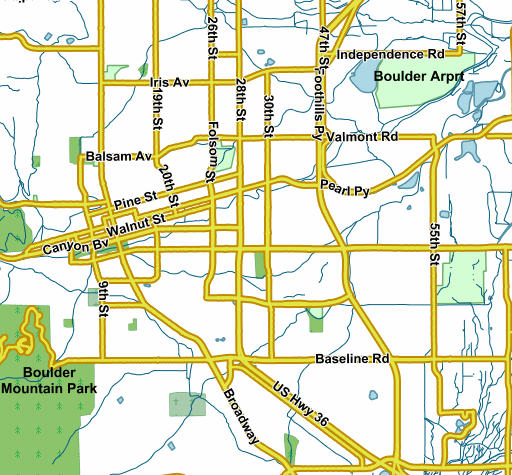
The PNG8 output
Parameters:FORMAT=image/png8 | Size: 58.0 KB | Map generation time: 190 ms
PNG + internet safe palette:
http://localhost:8083/geoserver/wms?service=WMS&version=1.1.0&request=GetMap&layers=geosolutions:BoulderCityLimits,geosolutions:blakes,geosolutions:bplandmarks,geosolutions:brivers,geosolutions:Mainrd&styles=&bbox=3056181.93510,1237476.92868,3080671.07513,1260141.38768&width=512&height=475&srs=EPSG:2876&format=image/png&palette=safe
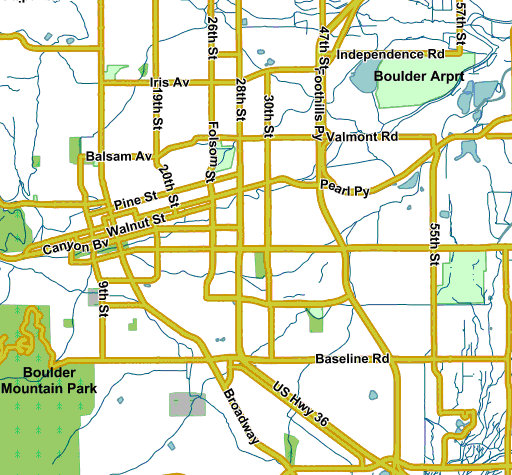
The PNG output + internet safe palette
Parameters:FORMAT=image/png&palette=safe | Size: 50 KB | Map generation time: 161 ms
PNG + palette by example:
http://localhost:8083/geoserver/wms?service=WMS&version=1.1.0&request=GetMap&layers=geosolutions:BoulderCityLimits,geosolutions:blakes,geosolutions:bplandmarks,geosolutions:brivers,geosolutions:Mainrd&styles=&bbox=3056181.93510,1237476.92868,3080671.07513,1260141.38768&width=512&height=475&srs=EPSG:2876&format=image/png&palette=boulder
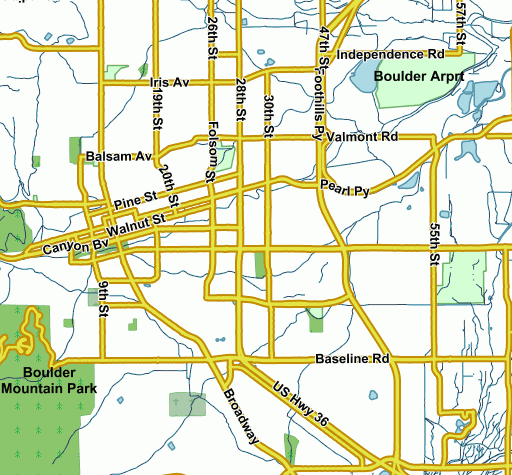
The PNG output palette by example
Parameters:FORMAT=image/png&palette=boulder | Size: 56 KB | Map generation time: 163 ms
Generating the custom palette
To generate a custom palette you can use IrfanView for example, on Windows. The steps are simple:
- open the png 24 bit version of the image
- use Image/Decrease Color Depth and set 256 colors
- use Image/Palette/Export to save the palette
An example with raster data
To give you an example when paletted images may not fit the bill, let’s consider the geosolutions:13tde815295_200803_0x6000m_cl coverage from the sample data and repeat the same operation as before.
Note
You should create the datastore related for the mentioned layer and to publish it following same instructions as in previous sections on training.
The standard PNG full color output:
http://localhost:8083/geoserver/geosolutions/wms?LAYERS=geosolutions%3A13tde815295_200803_0x6000m_cl&STYLES=&SERVICE=WMS&VERSION=1.1.1&REQUEST=GetMap&SRS=EPSG%3A26913&BBOX=482574.82910157,4429949.7070313,482949.82910157,4430324.7070313&WIDTH=512&HEIGHT=512&FORMAT=image%2Fpng
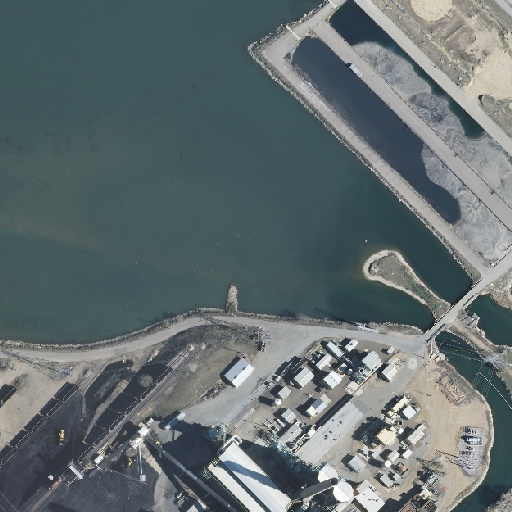
The standard PNG output
Parameters:FORMAT=image/png | Size: 528.9 KB | Map generation time:90ms
JPEG output:
http://localhost:8083/geoserver/geosolutions/wms?LAYERS=geosolutions%3A13tde815295_200803_0x6000m_cl&STYLES=&SERVICE=WMS&VERSION=1.1.1&REQUEST=GetMap&SRS=EPSG%3A26913&BBOX=482574.82910157,4429949.7070313,482949.82910157,4430324.7070313&WIDTH=512&HEIGHT=512&FORMAT=image%2Fjpeg
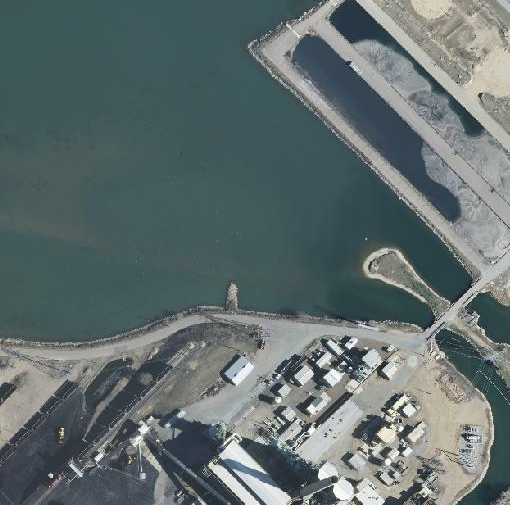
JPEG output
Parameters:FORMAT=image/jpeg | Size: 39.5 KB | Map generation time: 35ms
PNG8 output (the output using a “palette by example would be the same”):
http://localhost:8083/geoserver/geosolutions/wms?LAYERS=geosolutions%3A13tde815295_200803_0x6000m_cl&STYLES=&SERVICE=WMS&VERSION=1.1.1&REQUEST=GetMap&SRS=EPSG%3A26913&BBOX=482574.82910157,4429949.7070313,482949.82910157,4430324.7070313&WIDTH=512&HEIGHT=512&FORMAT=image%2Fpng8
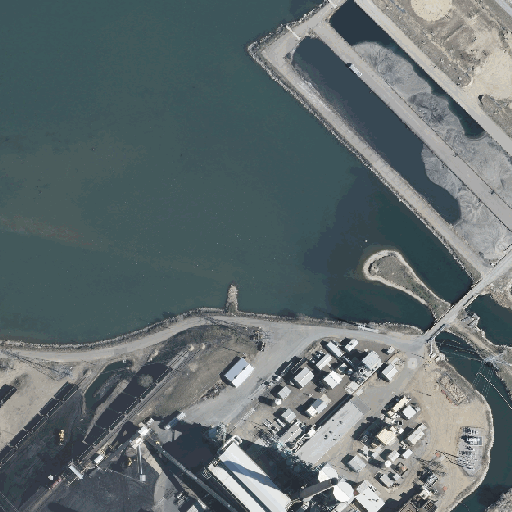
PNG8 output
Parameters:FORMAT=image/png8 | Size: 141.8 KB | Map generation time: 201ms
PNG output + safe palette:
http://localhost:8083/geoserver/geosolutions/wms?LAYERS=geosolutions%3A13tde815295_200803_0x6000m_cl&STYLES=&SERVICE=WMS&VERSION=1.1.1&REQUEST=GetMap&SRS=EPSG%3A26913&BBOX=482574.82910157,4429949.7070313,482949.82910157,4430324.7070313&WIDTH=512&HEIGHT=512&FORMAT=image%2Fpng&palette=safe
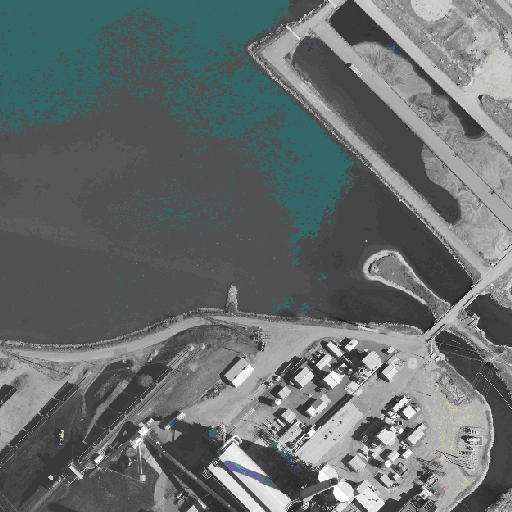
PNG + sape palette output
Parameters:FORMAT=image/png&palette=safe | Size: 96.8 KB | Map generation time: 235ms
Note
As the sampler shows, the JPEG output has the same quality as the full color image, it is generated faster and uses only a fraction of its size. At the opposite, the version using the internet safe palette is fast and smaller than the full PNG but the output is totally ruined. Everything considered, JPEG is the clear winner, sporting good quality, fast image generation and smaller size. PNGs are the suggested imagery raster format only in case the output needs to be used as an overlay and thus requires transparent areas or when the raster has large areas with uniform colors, which may happen for example in land use rasters.
