Basic Configuration of the Monitor Extension
Many aspects of the monitor extension are configurable. All configuration files
are stored in the data directory under the monitoring directory:
<data_directory>
    monitoring/
        db.properties
        filter.properties
        hibernate.properties
        monitor.properties
The function of these files will be discussed below.
Monitor Mode
The monitoring extension supports different “monitoring modes” that control how request data is captured and stored. Currently three modes are supported:
- history (Default) - Only historical request information is available. No live information is maintained.
- live - Only information about live requests is maintained.
- mixed - A combination of live and history. This mode is experimental.
The mode is set in the monitor.properties file.
Note
For the Virtual Machine GeoServer instance, we are “live” mode.
History Mode
History mode persists information about all requests in an external database. It does not provide any real time information. This mode is appropriate in cases where a user is most interested in analyzing request history over a given time period.
Live Mode
Live mode only maintains short lived information about requests that are currently executing. It also maintains a small buffer of recent requests. No external database is used with this mode and no information is persisted for the long term.
This mode is most appropriate in cases where a user only cares about what a server is doing in real time and is not interested about request history.
Mixed Mode
Mixed mode combines both live and history mode in that it maintains both real time information and persists all request data to the monitoring database. This mode however is experimental and comes with more overhead than the other two modes. This is because mixed mode must perform numerous database transactions over the life cycle of a single request (in order to maintain live information), whereas history mode only has to perform a single database transaction for a request.
This mode is most appropriate when both real time request information and request history are desired. This mode is also most appropriate in a clustered server environment in which a user is interested in viewing real time request information about multiple nodes in a cluster.
Monitor Database
By default monitored request data is stored in an embedded H2 database located
in the monitoring directory. This can be changed by editing the
db.properties file:
# default configuration is for h2
driver=org.h2.Driver
url=jdbc:h2:file:${GEOSERVER_DATA_DIR}/monitoring/monitoring
For example to store request data in an external PostgreSQL database:
driver=org.postgresql.Driver
url=jdbc:postgresql://localhost:5432/monitoring
username=bob
password=foobar
Warning
The above is just an example. Does not match the training users and environment.
Request Filters
By default not all requests are monitored. Those excluded requests include any web admin requests or any monitor HTTP API requests. These exclusions are configured in the filter.properties file:
/rest/monitor/**
/web
/web/**
These default filters can be changed or extended to filter more types of requests. For example to filter out all WFS requests:
/wfs
How to determine the filter path
The contents of filter.properties are a series of ant-style patterns that
are applied to the path of the request. Consider the following request:
http://localhost:8083/geoserver/wms?request=getcapabilities
The path of the above request is /wms.
In the following request:
http://localhost:8083/geoserver/rest/workspaces/topp/datastores.xml
The path is /rest/workspaces/topp/datastores.xml.
In general, the path used in filters is comprised of the portion of the URL
after /geoserver (including the preceding /) and before the query string ?:
http://<host>:<port>/geoserver/<path>?<queryString>
Note
For more information about ant-style pattern matching, see the Apache Ant manual.
Go to the Map Map Preview and open the geosolutions:Counties layer clicking on the
OpenLayerlink.Perform a few times zoom the map.
Use also the GML preview for said layer
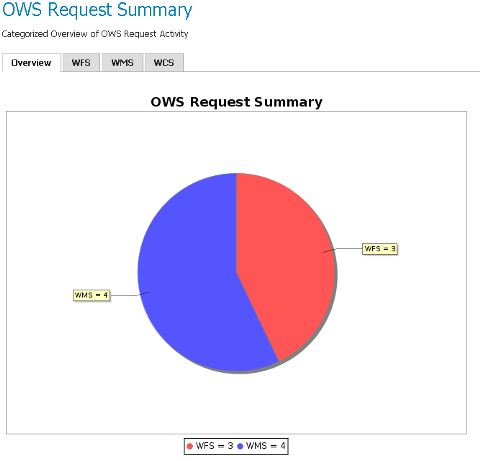
Navigate to the Monitor/Reports section
Click on
OWS Request Summaryto show a detailed chart like the following: