
Generating a KML Time Series
When spatial data is combined with temporal information the visualization effects can be very interesting. Showing how objects change spatially over time is a powerful animation commonly referred to as a time series. This section covers how to use GeoServer templates in conjunction with Google Earth support for time to create a time series.
In the same directory that the
title.ftlanddescription.ftltemplates were created in the previous section, created a new template calledtime.ftl.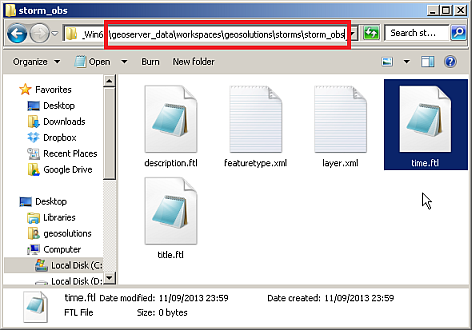
Creating a new time template
Open
time.ftlwith a text editor and enter the following content:${obs_datetime.value}Note
Time templates work by obtaining a date from a temporal attribute.
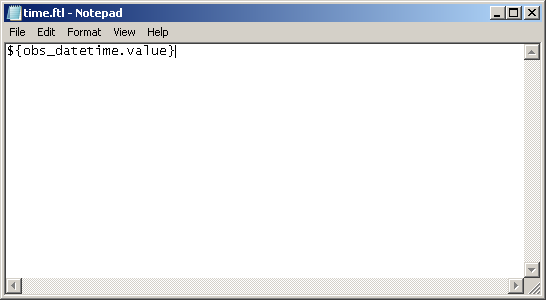
Creating content for a time template.
Save
time.ftl, delete thestorm-obslayer and follow this link:http://localhost:8083/geoserver/wms/kml?layers=geosolutions:storm_obs&mode=download
Note
This time we are using
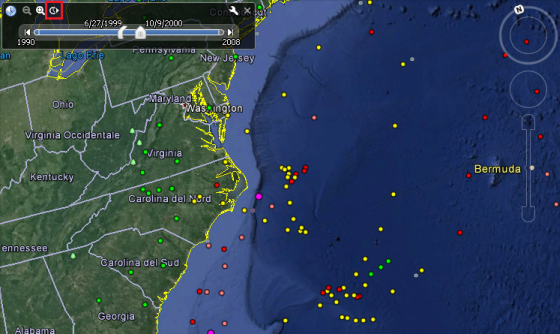
mode=downloadto have GE get the full data set, since we are going to see parts of it based on time as opposed to geographic area and importanceA time slider should appear at the top of the view port.
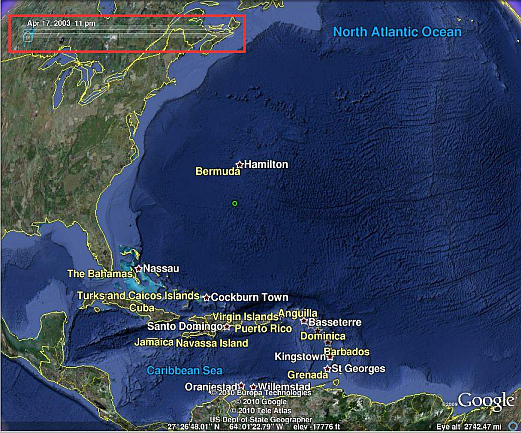
Viewing temporal data in Google Earth
Change the time interval in the time slider to about 1 month, and adjust the animation speed to be slow.
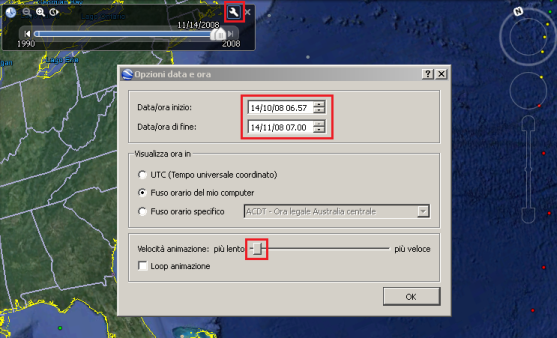
Adjusting time animation settings.
Click OK and start the animation clicking on the clock button on the top.
Viewing the hurricane time series
At this point a temporal animation of the data set has been created with the simple use of templates. In the next section templates will be used yet again to add another aspect to the visualization.