Rendering Transformations: Wind arrows
In this section we will use a wind mosaic with two bands and we will apply a Rendering Transformation which will draw dynamically wind arrows.
Dataset description
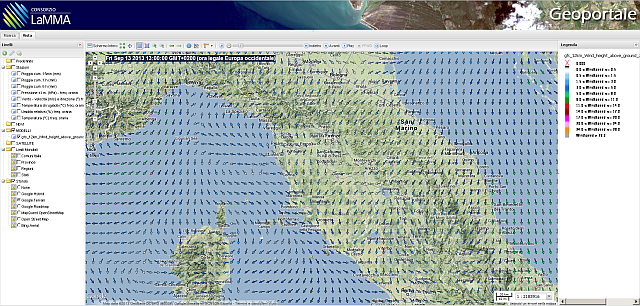
The dataset is taken from a run of the GFS 12Km Wind model above ground from LAMMA (http://geoportale.lamma.rete.toscana.it/MapStore/public/).
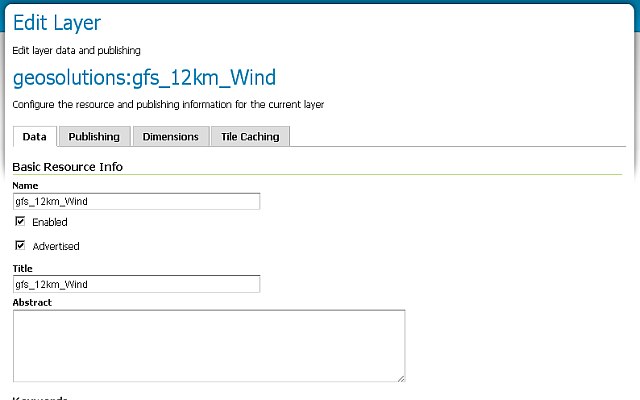
The layer geosolutions:gfs_12km_Wind is an ImageMosaic with two Float Bands and two dimensions (time and elevation).
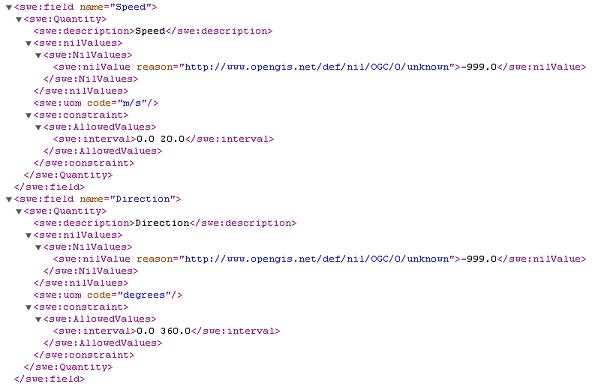
The granules are Float GeoTIFFs with two Bands, the wind speed and the wind direction expressed in degrees.
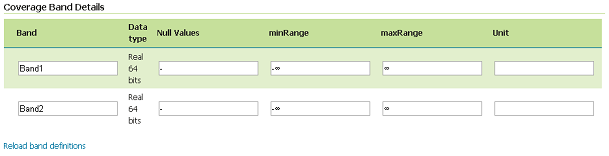
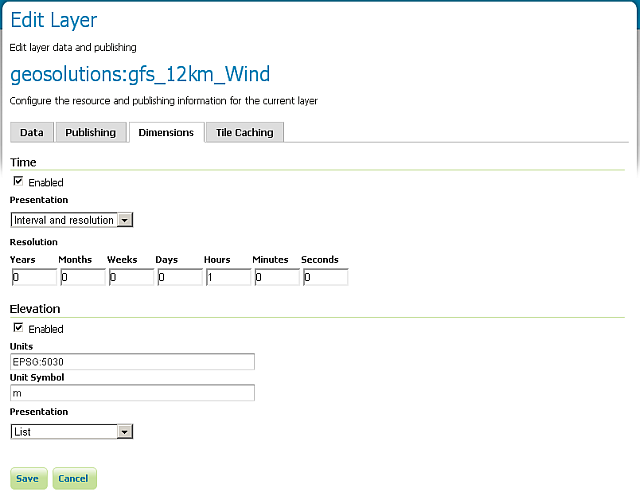
The ImageMosaic has two dimensions (make sure that both of them are set as the screenshot below).
Rendering Transformation
The wind_arrow_palette SLD, is based on WKT Mark GeoTools plugin and has several rules to draw the arrows with a color and a direction accordingly to the bands values.
Here below a snippet of the SLD
<StyledLayerDescriptor version="1.0.0"
  xmlns="http://www.opengis.net/sld" xmlns:gml="http://www.opengis.net/gml"
  xmlns:ogc="http://www.opengis.net/ogc" xmlns:xlink="http://www.w3.org/1999/xlink"
  xmlns:xsi="http://www.w3.org/2001/XMLSchema-instance"
  xsi:schemaLocation="http://www.opengis.net/sld ./StyledLayerDescriptor.xsd">
    <NamedLayer>
        <Name>Wind</Name>
        <UserStyle>
            <Title>Wind</Title>
            <FeatureTypeStyle>

                <Transformation>
                    <ogc:Function name="gs:RasterAsPointCollection">
                        <ogc:Function name="parameter">
                            <ogc:Literal>data</ogc:Literal>
                        </ogc:Function>
                    </ogc:Function>
                </Transformation>

                <Rule>
                    <!-- <MaxScaleDenominator>2500000</MaxScaleDenominator> -->
                    <Filter>
                        <And>
                            <PropertyIsGreaterThanOrEqualTo>
                                <PropertyName>Band1</PropertyName>
                                <Literal>0</Literal>
                            </PropertyIsGreaterThanOrEqualTo>
                            <PropertyIsLessThanOrEqualTo>
                                <PropertyName>Band1</PropertyName>
                                <Literal>0.5</Literal>
                            </PropertyIsLessThanOrEqualTo>
                        </And>
                    </Filter>
                    <PointSymbolizer>
                        <Graphic>
                            <Mark>
                                <WellKnownName>extshape://narrow</WellKnownName>
                                <Stroke>
                                    <CssParameter name="stroke">#000000</CssParameter>
                                    <CssParameter name="stroke-width">0.6</CssParameter>
                                </Stroke>
                                <Fill>
                                    <CssParameter name="fill">
                                        <ogc:Literal>#f5ffff</ogc:Literal>
                                    </CssParameter>
                                </Fill>
                            </Mark>
                            <Size>4</Size>
                            <Rotation>
                                <ogc:Function name="if_then_else">
                                    <ogc:Function name="greaterThan">
                                        <ogc:PropertyName>Band2</ogc:PropertyName>
                                        <ogc:Literal>180</ogc:Literal>
                                    </ogc:Function>
                                    <ogc:Sub><ogc:PropertyName>Band2</ogc:PropertyName><ogc:Literal>180</ogc:Literal></ogc:Sub>
                                    <ogc:Add><ogc:PropertyName>Band2</ogc:PropertyName><ogc:Literal>180</ogc:Literal></ogc:Add>
                                </ogc:Function>
                            </Rotation>
                        </Graphic>
                    </PointSymbolizer>
                </Rule>
                ...
            </FeatureTypeStyle>
        </UserStyle>
    </NamedLayer>
</StyledLayerDescriptor>
As you may notice there are several <Rules> based on <ogc:Filter>. The Filter makes checks against the Band1 values.
<Filter>
        <And>
                <PropertyIsGreaterThanOrEqualTo>
                        <PropertyName>Band1</PropertyName>
                        <Literal>0</Literal>
                </PropertyIsGreaterThanOrEqualTo>
                <PropertyIsLessThanOrEqualTo>
                        <PropertyName>Band1</PropertyName>
                        <Literal>0.5</Literal>
                </PropertyIsLessThanOrEqualTo>
        </And>
</Filter>
If the Rule matches a <PointSymbolizer> is applied to the Raster values which have been grabbed using a <gs:RasterAsPointCollection> Rendering Transformation.
<Transformation>
        <ogc:Function name="gs:RasterAsPointCollection">
                <ogc:Function name="parameter">
                        <ogc:Literal>data</ogc:Literal>
                </ogc:Function>
        </ogc:Function>
</Transformation>
Finally the <PointSymbolizer> use a shape in order to render an arrow.
<PointSymbolizer>
    <Graphic>
        <Mark>
            <WellKnownName>extshape://narrow</WellKnownName>
It applies a color and dimension accordingly to the filter
<Stroke>
    <CssParameter name="stroke">#000000</CssParameter>
    <CssParameter name="stroke-width">0.6</CssParameter>
</Stroke>
<Fill>
    <CssParameter name="fill">
        <ogc:Literal>#f5ffff</ogc:Literal>
    </CssParameter>
</Fill>
and applies a rotation accordingly to the value of the Band2.
<Rotation>
    <ogc:Function name="if_then_else">
        <ogc:Function name="greaterThan">
            <ogc:PropertyName>Band2</ogc:PropertyName>
            <ogc:Literal>180</ogc:Literal>
        </ogc:Function>
        <ogc:Sub><ogc:PropertyName>Band2</ogc:PropertyName><ogc:Literal>180</ogc:Literal></ogc:Sub>
        <ogc:Add><ogc:PropertyName>Band2</ogc:PropertyName><ogc:Literal>180</ogc:Literal></ogc:Add>
    </ogc:Function>
</Rotation>
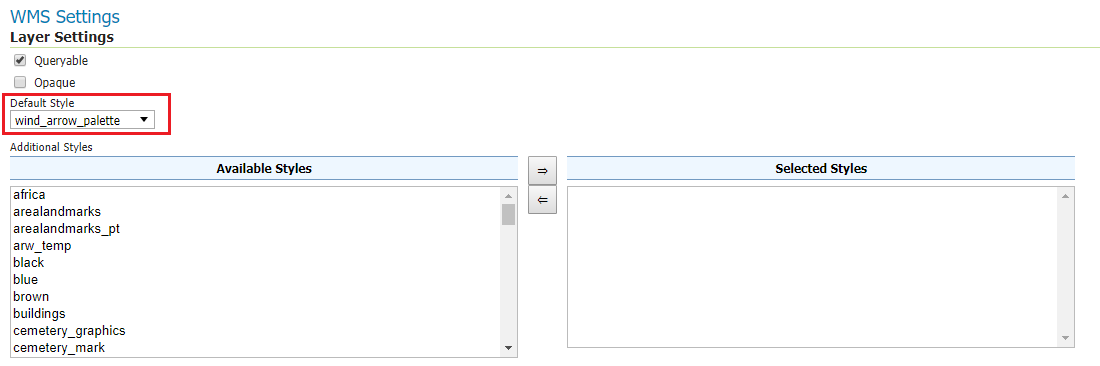
In the Publishing section, set the default style as wind_arrow_palette.
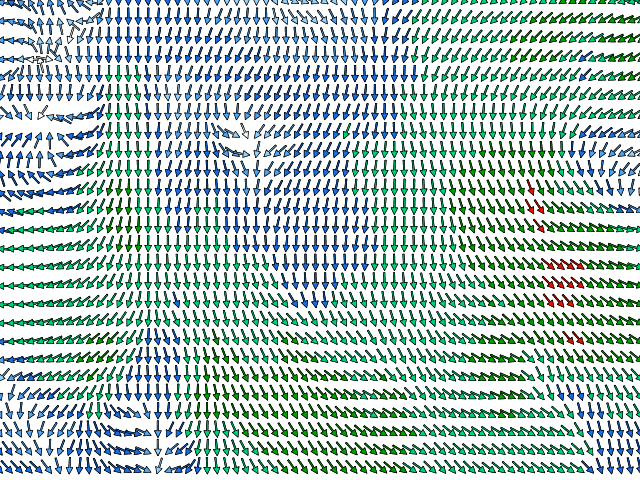
The outcome can be seen from the GeoServer Layer Preview page, clicking on the geosolutions:gfs_12km_Wind layer.
Also the following WMS GetMap Request allows to download a slice of the wind dataset drawn using the Rendering Transformation above
Optionally you can change the default parameters of the two bands in this way:
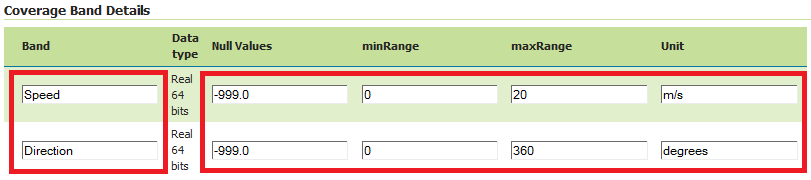
If the rename is carried out, the wind_arrow_palette SLD file will have to be modified
to use the new band names, otherwise no WMS output will be generated anymore.
Changing the name of the bands affects WCS in a evident way, as they are exposed in the DescribeCoverage operation and will then be used in GetCoverage (we will delve into these later in the training material):