
Adding a Style
The most important function of a Web Map Server is the ability to style and render data. This section covers the task of adding a new style to GeoServer and configuring the default style for a particular layer.
From the GeoServer Welcome Page navigate to Styles.
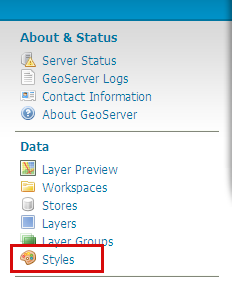
Navigating to Style configuration
Click Add a new style

Adding a new style
Click on the file upload dialogue.
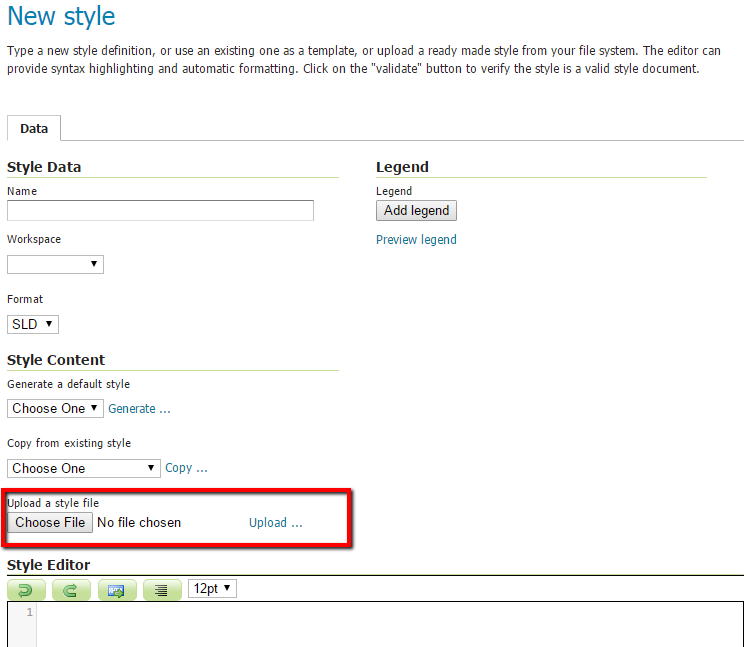
Populating from a file.
Navigate to the workshop (on Linux)
$TRAINING_ROOT/data/user_data/directory (on Windows%TRAINING_ROOT%\data\user_data\), select thefoss4g_mainrd.sldfile, and click Upload.Note
In GeoServer, styles are represented via SLD (Styled Layer Descriptor) documents. SLD is an XML format for specifying the symbolization of a layer. When a SLD document is uploaded the contents are shown in the text editor. The editor can be used to edit the contents of the SLD directly.
Enter “mainrd” in the Name field.
Add the new style by clicking Submit. Once it’s saved, you should see something like this:
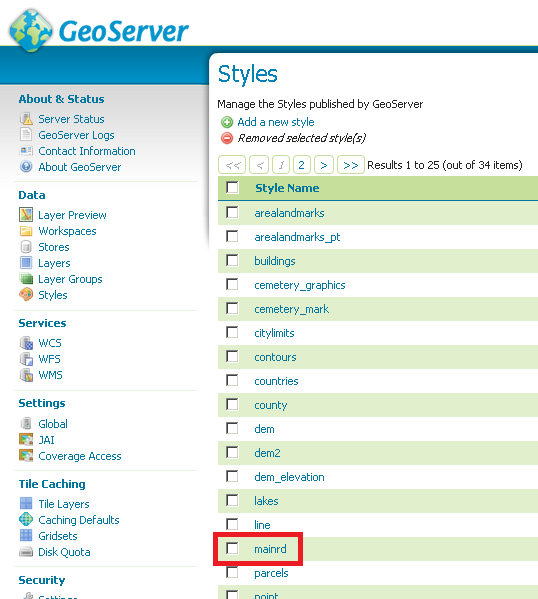
Submitting style
After having created the style, it’s time to apply it to a vector layer. Click on the Layers link.
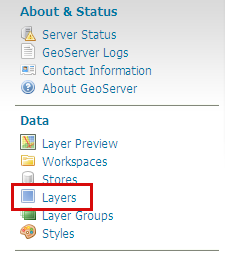
Navigating to Layers
Select the “Mainrd” on the Layers page.
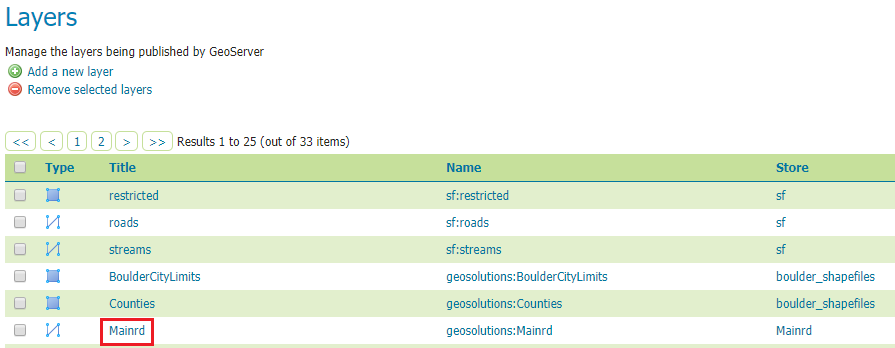
Selecting a layer
Select the Publishing tab.
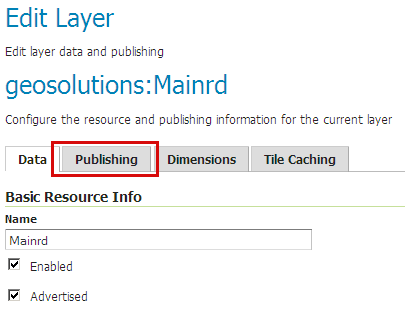
Publishing tab
Assign the new created style “mainrd” as the default style.
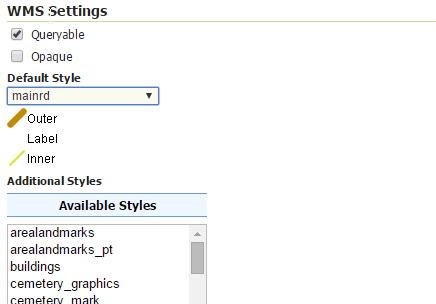
Publishing tab
Warning
Many new users mistake the Available Styles for the Default Style, please take into account that they are different, the default one allows that style to be used implicitly when no style is specified in a map request, while the available ones are just optional compatible styles.
Note
Geoserver 2.x assigns a default style depending on the geometry of the objects and the type, for example: line, poly, raster, point.
Scroll to the bottom of the page and hit Save.
Use the map preview to show how looks the style, please note you’ll have to zoom in once to show the data due to the map scale filters (
MaxScaleDenominatordirective in the SLD).