
Examine an existing style
From the GeoServer Welcome Page navigate to Styles.
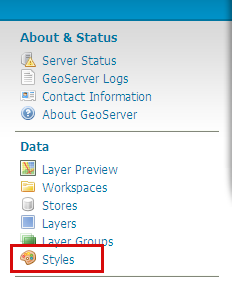
Navigating to Style configuration
From the styles list select the citylimits style
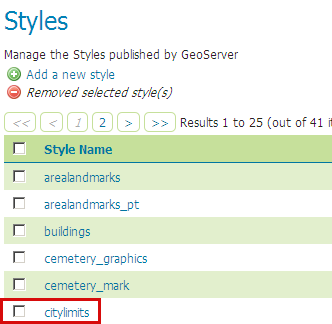
The styles list
Inside the Style Editor we have the following style:
<?xml version="1.0" encoding="UTF-8"?>
<sld:StyledLayerDescriptor xmlns="http://www.opengis.net/sld"
    xmlns:sld="http://www.opengis.net/sld"
    xmlns:ogc="http://www.opengis.net/ogc"
    xmlns:gml="http://www.opengis.net/gml"
    version="1.0.0">
  <sld:UserLayer>
    <sld:LayerFeatureConstraints>
      <sld:FeatureTypeConstraint/>
    </sld:LayerFeatureConstraints>
    <sld:UserStyle>
      <sld:Name>BoulderCityLimits</sld:Name>
      <sld:Title/>
      <sld:IsDefault>1</sld:IsDefault>
      <sld:FeatureTypeStyle>
        <sld:Name>group 0</sld:Name>
        <sld:FeatureTypeName>Feature</sld:FeatureTypeName>
        <sld:SemanticTypeIdentifier>generic:geometry</sld:SemanticTypeIdentifier>
        <sld:SemanticTypeIdentifier>simple</sld:SemanticTypeIdentifier>
        <sld:Rule>
          <sld:Name>Filled</sld:Name>
          <sld:MinScaleDenominator>75000</sld:MinScaleDenominator>
          <sld:PolygonSymbolizer>
            <sld:Fill>
              <sld:CssParameter name="fill">#7F7F7F</sld:CssParameter>
              <sld:CssParameter name="fill-opacity">0.5</sld:CssParameter>
            </sld:Fill>
            <sld:Stroke>
              <sld:CssParameter name="stroke">#7F7F7F</sld:CssParameter>
              <sld:CssParameter name="stroke-opacity">0.5</sld:CssParameter>
              <sld:CssParameter name="stroke-width">2.0</sld:CssParameter>
            </sld:Stroke>
          </sld:PolygonSymbolizer>
          <sld:TextSymbolizer>
            <sld:Label>
              <ogc:Literal>Boulder</ogc:Literal>
            </sld:Label>
            <sld:Font>
              <sld:CssParameter name="font-family">Arial</sld:CssParameter>
              <sld:CssParameter name="font-size">14.0</sld:CssParameter>
              <sld:CssParameter name="font-style">normal</sld:CssParameter>
              <sld:CssParameter name="font-weight">normal</sld:CssParameter>
            </sld:Font>
            <sld:LabelPlacement>
              <sld:PointPlacement>
                <sld:AnchorPoint>
                  <sld:AnchorPointX>
                    <ogc:Literal>0.0</ogc:Literal>
                  </sld:AnchorPointX>
                  <sld:AnchorPointY>
                    <ogc:Literal>0.5</ogc:Literal>
                  </sld:AnchorPointY>
                </sld:AnchorPoint>
                <sld:Rotation>
                  <ogc:Literal>0</ogc:Literal>
                </sld:Rotation>
              </sld:PointPlacement>
            </sld:LabelPlacement>
            <sld:Fill>
              <sld:CssParameter name="fill">#000000</sld:CssParameter>
            </sld:Fill>
            <sld:VendorOption name="maxDisplacement">200</sld:VendorOption>
            <sld:VendorOption name="group">true</sld:VendorOption>
          </sld:TextSymbolizer>
        </sld:Rule>
      </sld:FeatureTypeStyle>
    </sld:UserStyle>
  </sld:UserLayer>
</sld:StyledLayerDescriptor>
Note
The most important section are:
The
<Rule>tag combines a number of symbolizers (we have also the possibility to define the OGC filter) to define the portrayal of a feature.The
<PolygonSymbolizer>styles polygons and contain styling information about their border (stroke) and their fill.The
<TextSymbolizer >specifies text labels and their style:<Label>Specifies the content of the text label<Font>Specifies the font information for the labels.<LabelPlacement>Sets the position of the label relative its associate feature.<Fill>Determines the fill color of the text label.- VendorOption
maxDisplacementControls the displacement of the label along a line. Normally GeoServer would label a polygon in its centroid, provided the location is not busy with another label and that the label is not too big compare to the polygon, or not label it at all otherwise. When the maxDisplacement is set, the labeller will search for another location within maxDisplacement pixels from the pre-computed label point. - VendorOption
GroupSometimes you will have a set of related features that you only want a single label for. The grouping option groups all features with the same label text, then finds a representative geometry for the group.
The
<MaxScaleDenominator>and<MinScaleDenominator>are used to apply a particular SLD rule to a specific scale. The above SLD makes sure that the Boulder border disappear once we zoom in enough to see the city details. An alternative approach could be to keep the layer showing, but switch it to a different style, for example a think red line, so that the details of the city are not disturbed by the polygon fill.
Now, back to the style list, select the rivers style.
Inside the Style Editor we have the following style:
<?xml version="1.0" encoding="UTF-8"?>
<sld:StyledLayerDescriptor xmlns="http://www.opengis.net/sld"
    xmlns:sld="http://www.opengis.net/sld"
    xmlns:ogc="http://www.opengis.net/ogc"
    xmlns:gml="http://www.opengis.net/gml"
    version="1.0.0">
  <sld:UserLayer>
    <sld:LayerFeatureConstraints>
      <sld:FeatureTypeConstraint/>
    </sld:LayerFeatureConstraints>
    <sld:UserStyle>
      <sld:Name>Hydrology Line</sld:Name>
      <sld:Title/>
      <sld:FeatureTypeStyle>
        <sld:Rule>
          <sld:Name>default rule</sld:Name>
          <sld:MaxScaleDenominator>75000</sld:MaxScaleDenominator>
          <sld:LineSymbolizer>
            <sld:Stroke>
              <sld:CssParameter name="stroke-width">0.5</sld:CssParameter>
              <sld:CssParameter name="stroke">#06607F</sld:CssParameter>
            </sld:Stroke>
          </sld:LineSymbolizer>
        </sld:Rule>
      </sld:FeatureTypeStyle>
    </sld:UserStyle>
  </sld:UserLayer>
</sld:StyledLayerDescriptor>
Note
This is a very simple Line style. Take into account the LineSymbolizer that styles lines. Lines are one-dimensional geometry elements that contain position and length. Lines can be comprised of multiple line segments.
The outermost tag is the <Stroke> tag. This tag is required, and determines the visualization of the line:
strokeSpecifies the solid color given to the line, in the form #RRGGBB. Default is black (#000000).stroke-widthSpecifies the width of the line in pixels. Default is1.
In this case
MaxScaleDenominatoris used to make sure that the rivers start showing up when we are zoomed in enough, and in particular as the city borders disappear
Create a simple style for points
From the GeoServer Welcome Page navigate to Style.
Navigating to Style configuration
Click New

Adding a new style
Enter “landmarks” in the Name field and select “SLD” in the Format field.
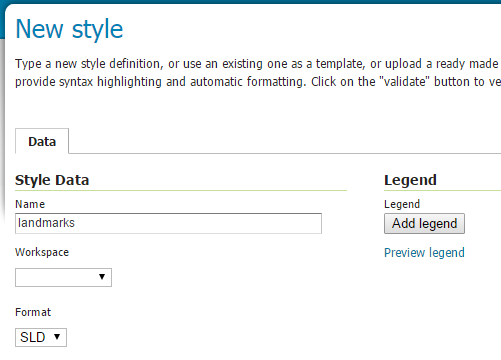
Creating a new style
In the SLD Editor enter the following XML:
<StyledLayerDescriptor xmlns="http://www.opengis.net/sld" xmlns:xsi="http://www.w3.org/2001/XMLSchema-instance" version="1.0.0" xsi:schemaLocation="http://www.opengis.net/sld http://schemas.opengis.net/sld/1.0.0/StyledLayerDescriptor.xsd">
  <NamedLayer>
    <Name>landmarks</Name>
    <UserStyle>
      <Name>landmarks</Name>
      <Title>Point Landmarks</Title>
      <FeatureTypeStyle>
        <Rule>
          <Name>default</Name>
          <Title>Landmarks</Title>
           <PointSymbolizer>
             <Graphic>
               <Mark>
                 <WellKnownName>triangle</WellKnownName>
                 <Fill>
                   <CssParameter name="fill">#009900</CssParameter>
                   <CssParameter name="fill-opacity">0.2</CssParameter>
                 </Fill>
                 <Stroke>
                   <CssParameter name="stroke">#000000</CssParameter>
                   <CssParameter name="stroke-width">2</CssParameter>
                 </Stroke>
               </Mark>
               <Size>12</Size>
             </Graphic>
           </PointSymbolizer>
        </Rule>
      </FeatureTypeStyle>
    </UserStyle>
  </NamedLayer>
</StyledLayerDescriptor>
Note
Take into account:
WellKnownNameThe name of the common shape. Options are circle, square, triangle, star, cross, or x. Default is square.fillSpecifies how the symbolizer should be filled. Options are a<CssParameter name="fill">specifying a color in the form#RRGGBB, or<GraphicFill>for a fill made with a repeated graphic.fill-opacityDetermines the opacity (transparency) of symbolizers. Values range from0(completely transparent) to1(completely opaque). Default is1.
Then click Save button.
Open the
geosolutions:bptlandmarksvector layer, but this time associate the style as an “Additional Style”: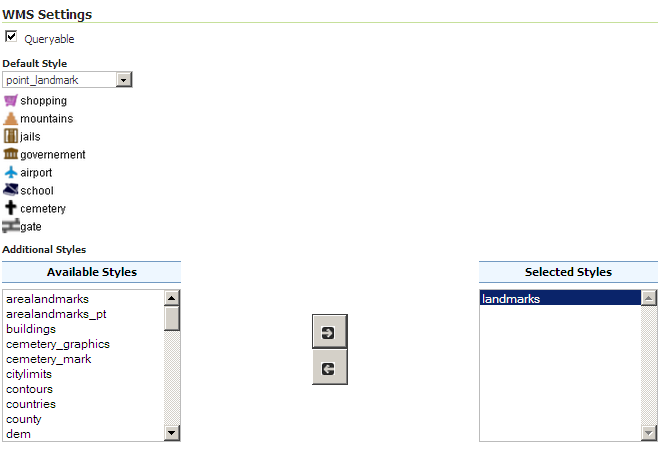
Open the Edit Layers, Publishing tab
Click on the Save button.
Preview the
geosolutions:bptlandmarkslayer, which with the default style should be empty due to scale dependencies. Then click the option button at the top left of the map and select thelandmarksstyle in the style drop down: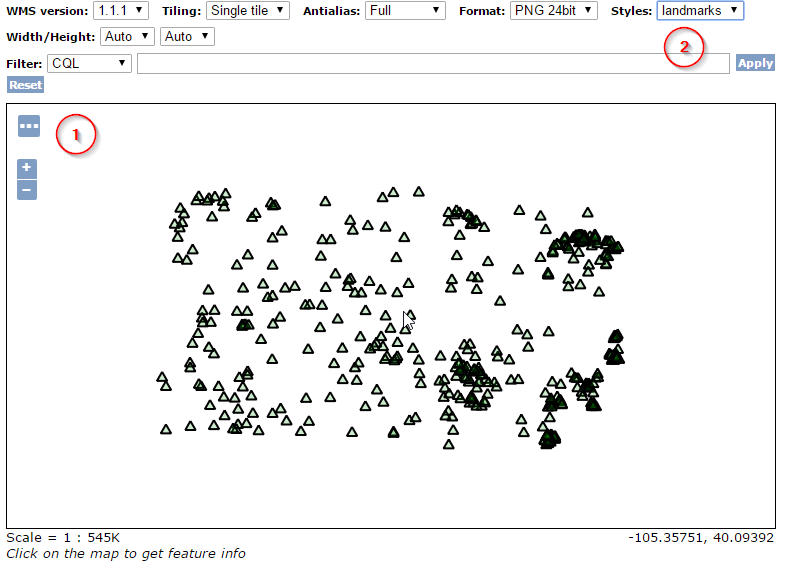
Open the Layers Preview
Create the same style with CSS
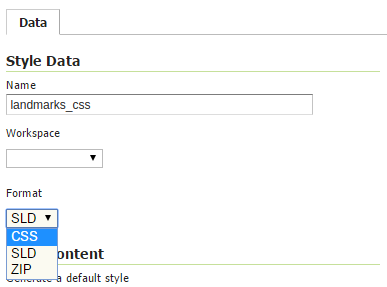
Create a new style named landmarks_css and select the CSS format.
Paste the following in the Style Editor:
* {
    mark: symbol(triangle);
    mark-size: 12;
    :nth-mark(1) {
        fill: #009900;
        fill-opacity: 0.2;
        stroke: #000000;
        stroke-width: 2;
    }
}
Save the style
Open the
geosolutions:bptlandmarksvector layer and associate the new style as an “Additional Style”Preview the
geosolutions:bptlandmarkslayer and select the new landmarks_css styleThe style appears identical to the SLD one
Note
Useful additional CSS documentation could be found at the following links: